Visual Communication · 2021
Making information visible
Fact visualisations, an Etsy seller infographic and a print-ready booklet.
CLIENTUniversity of Queensland · Academic project
MY ROLESole Graphic Designer
YEAR2021

Design
01
The challenge
The brief explored how visual hierarchy, comparison and graphic form can make numerical information easier to understand.
02
The approach
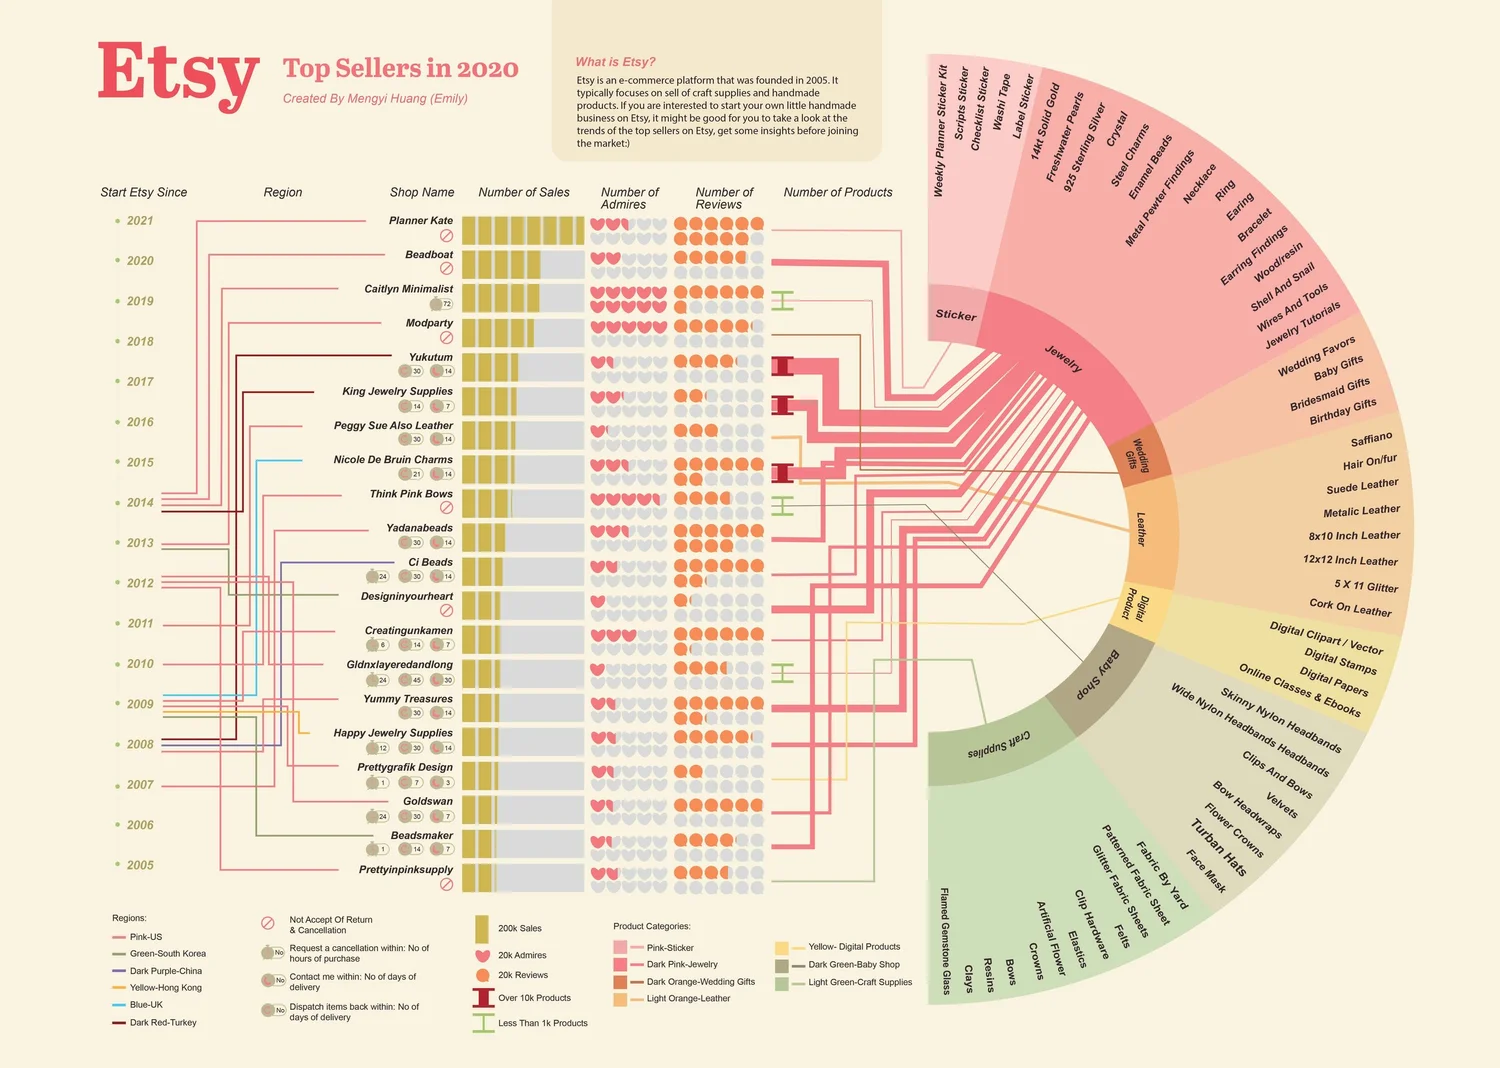
I iterated three fact posters through feedback, designed an A2 infographic on the top Etsy sellers in 2020, and assembled a 32-page booklet in InDesign. Colour, typography and visual metaphors tied the work together.
03
The outcome
The final academic submission combined fact visualisation, a comparative infographic and a print-ready editorial format, with the original data sources documented in the project.